
TFabConnect
User Manual
Purpose
More than 5 million micro:bits have been shipped and used in many educational scenes around the world. And it can be one of the tools that can physically solve our daily problems (SDGs, etc).
If you use micro:bit for solution, you would observe the value change in its sensor in a far place and try to do something with it.
Micro:bit has radio function but it dose not work over 20 meters. Therefore, you need to buy Wi-Fi module if you want to communicate with micro:bit in the distance.
Also, if students try to connect their Wi-Fi modules at once in a school lesson, the maximum limit of Wi-Fi access points that can be connected concurrently may be reached.
TFabConnect is the service that you can graph the values in micro:bit sensors located far away and share variables in a cloud between two micro:bits without Wi-Fi module.
Structure
Micro:bit can connect to the internet via PC browser.
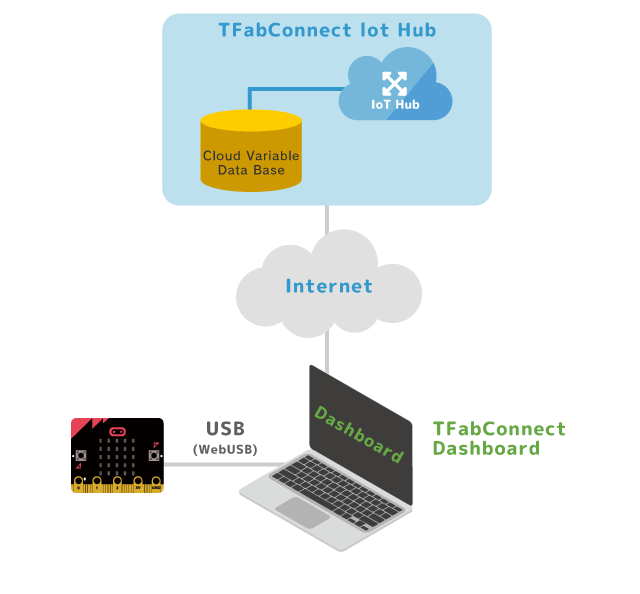

Cloud variable is used for connecting to the internet. Loading the MakeCode extensions for TFabConnect, special blocks which can read and write cloud variable become available. If a value (e.g., temp) continues to be written in cloud variable you defined, it will be accumulated in the database of TFabConnect server.
Accumulated data is graphed on TFabConnect Dashboard, and you can look at the time-series variation.
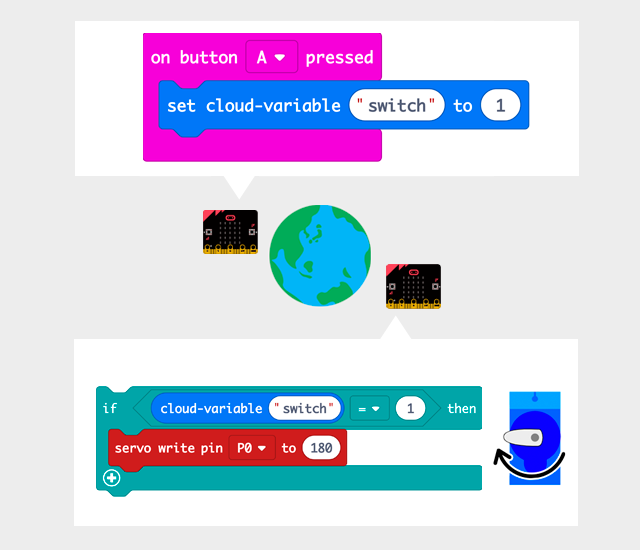
A pair of micro:bit can belong to the same group, read and write the same cloud-variable even if they are far apart each other. For example, you can make easily some works that servomotors rotate pressing button A on micro:bit from the other side of the earth.
Tutorial
Let's check the graph and the change in light level while away from your home.
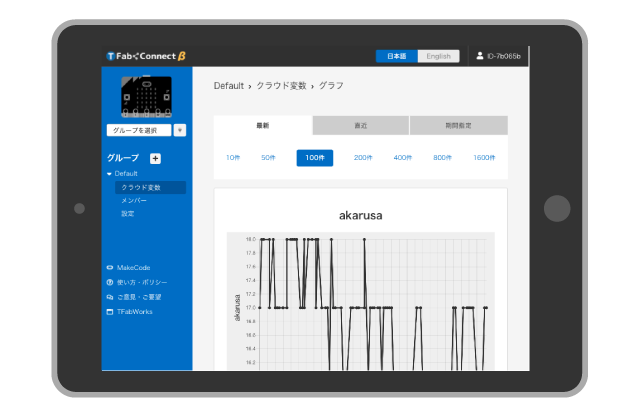
Build an environment to observe the change in light level wherever you go.
Things to prepare
- micro:bit + USB cable + PC
-
Access dashboard
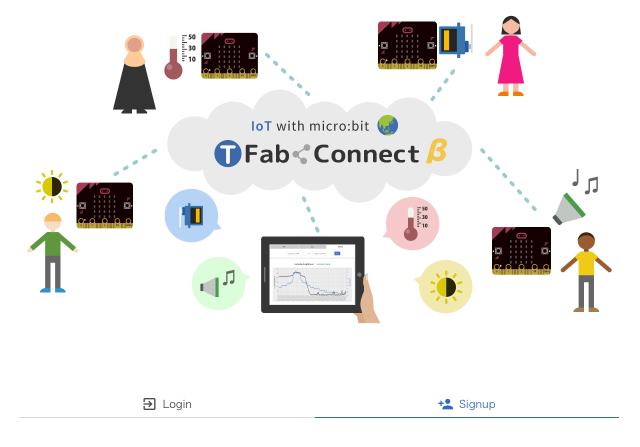
Firstly, access dashboard. https://beta.tfabconnect.com/dashboard/
When you access it for the first time, you will see a selection screen like this.
It is possible to draw or see the time-series graph even if you select "Temporary use". If you want to use it enduringly, select "Signup" and "Social signup" or "Login" and "Social login".
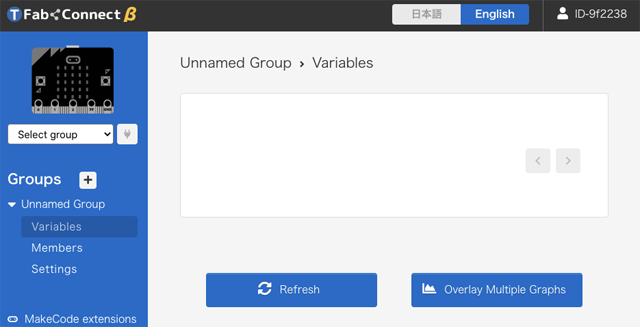
After you signup or signin dashboard, you can see a group named "Unnamed Group".
-
Make program(MakeCode)
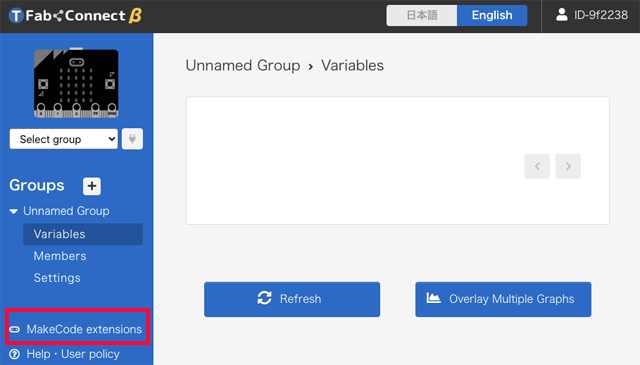
Click "MakeCode extensions" in the left menu. Or access http://tfab.jp/connect-b to go to the website "MakeCode".
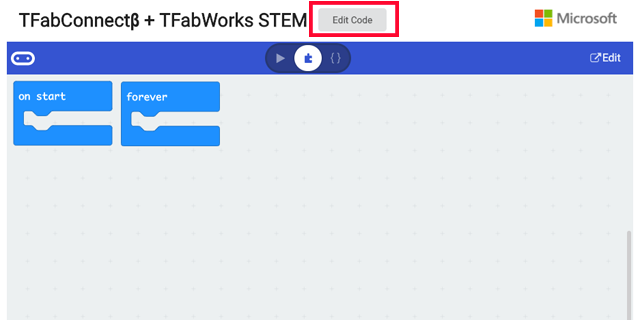
Clicking "Edit Code", the specialized blocks for TFabConnect will be loaded.( There is also a way to read https://github.com/tfabworks/pxt-tfabconnect-beta in extensions. )
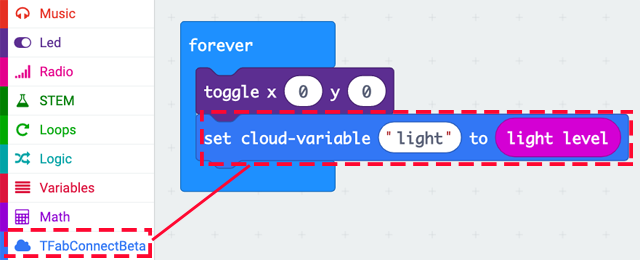
Put the block "cloud-variable" in the block "forever", and set the light level value to cloud-variable named "light". Cloud-variable can be freely named, but only half-width English numbers can be used.
To check if operating correctly, use "toggle x ~ y ~" so that the LED turns on and off each time the cloud-variable is written.
Install it onto micro:bit when it have been completed.
-
Connect your micro:bit to the internet(Use WebUSB on the dashboard)
If MakeCode is connected to WebUSB, close the browser tab once.
Next, connect micro:bit to the "Unnamed group" via WebUSB on the dashboard. Following the procedure below, micro:bit illustration turns red. Then the record of light level will be started onto "Unnamed Group".

-
Display a graph
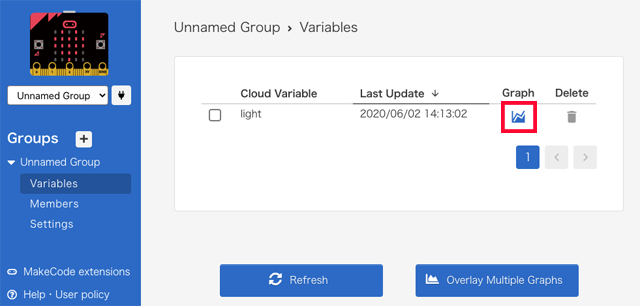
After a while, the variable "light" will appear in the list of variables, and then click the graph icon on the right.
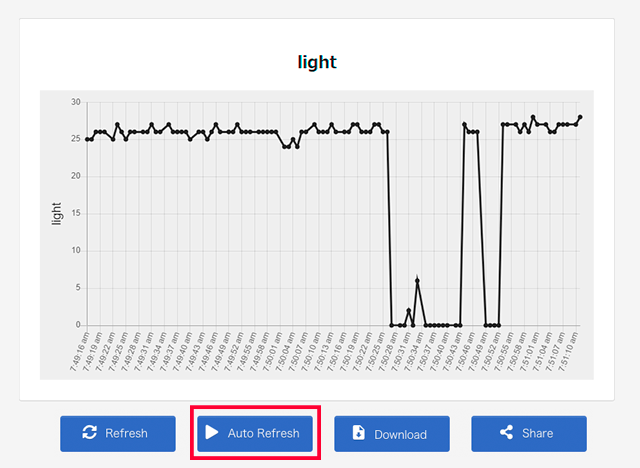
When the graph is displayed, click the "Auto Refresh" at the bottom center and try covering micro:bit with your hand. If the graph falls after a few seconds, you succeed.
-
Check the graph when you go out.
There are two ways to check a graph from outside.
Use social login
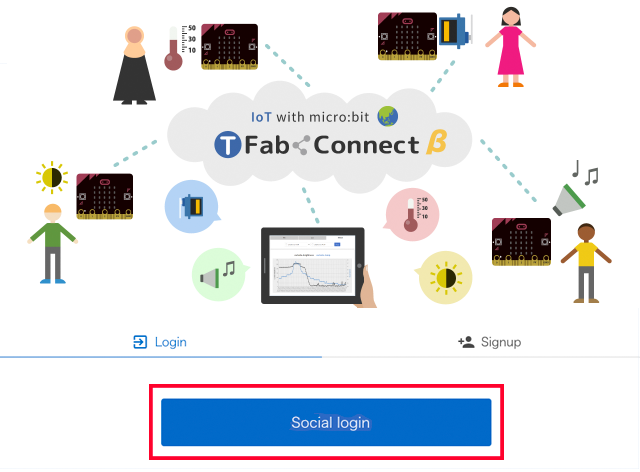
By accessing https://beta.tfabconnect.com/dashboard/ from outside and loging in it with your social media account, you can check the current brightness.
Use publishing feature
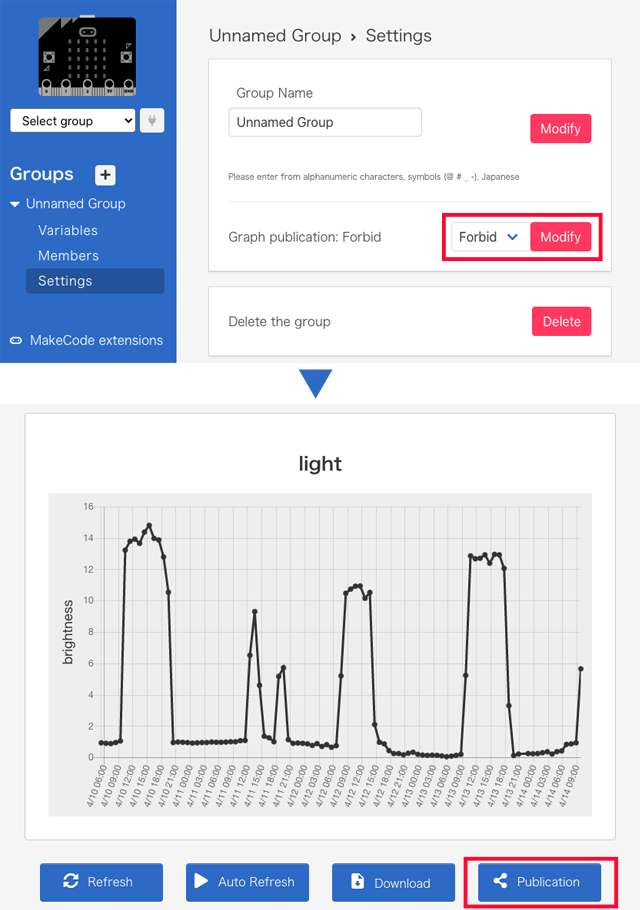
- Select Settings on Unnamed group, then change the status from "Forbid" to "Allow" on Graph publication.
- Indicate the graph you want to open to the public, then click the button "Publication" at the bottom right.
- A URL for viewing from outside is generated. It can be available by smartphones without login.
Examples of utilization
Instrument shelter
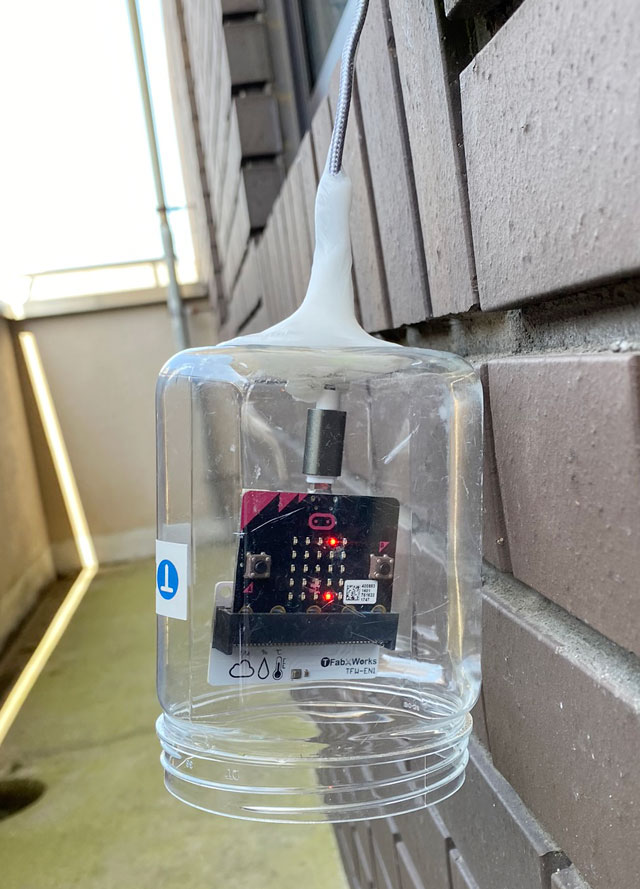
You can record the changes of light level and temperature in a day, and can refer to them from remote place.
- Poke a hole in the bottom of the PET bottle and attach a USB cable with putty, then set it on the shaded veranda.
- We connected TFW-EN1 to micro:bit as a thermometer but you can substitute the sensor of micro:bit for it, if you do not mind the temperature error about ±2℃.
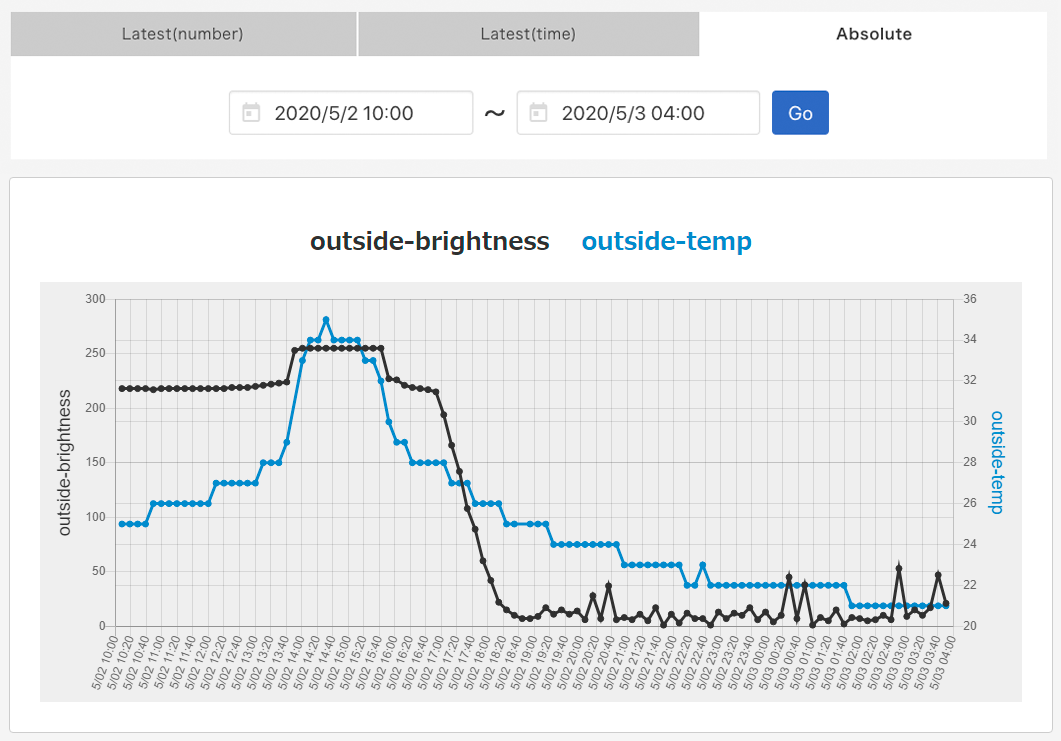
As a result, TFabConnect drew the graph like the following. It shows the blue line (temperature) fell after the black one (sunset) did.
You can realize the measurement program like this with only 8 blocks.
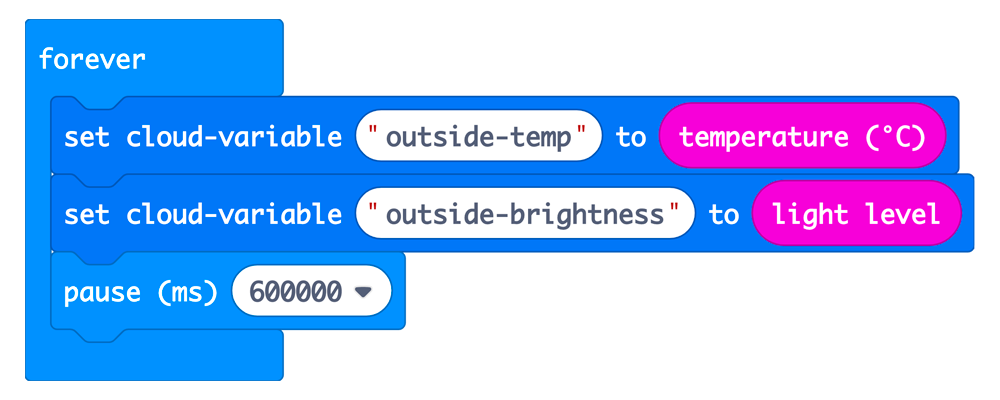
*It is recorded in a database on the cloud every 10 minutes (= 600000 milliseconds).
Keep watch on nocturnal animals
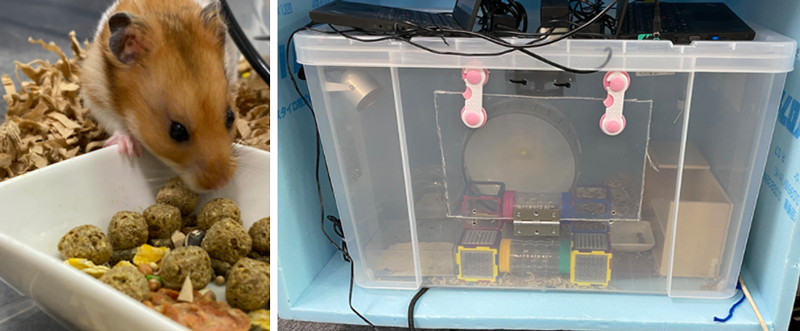
Golden hamsters are nocturnal animals. Using TFW-RK2 which is equipped with an infrared motion sensor, we tried to visualize the movement of the hamster in a graph.
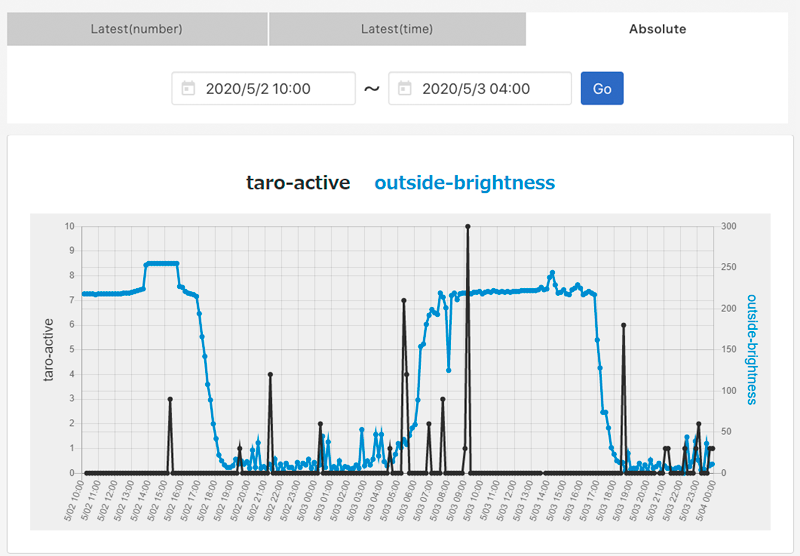
This graph superposes the values of "outside-brightness" and "taro-active". "outside-brightness" is the light level that the instrument shelter measured in the first example, and "taro-active" is the number of times that the micro:bit with TFW-RK2 detected the movement of hamster. You can see it actively moves during the dark time zone.
This measurement can be realized with the following program.

The blocks on the left side check the value of the motion sensor every 10 seconds and increase the value of "counter" by 1 if it detects movements. The blocks on the right side write the value of "counter" to cloud-variable "taro-active" every 10 minutes (=600000 milliseconds) and reset "counter".
More Suggestions
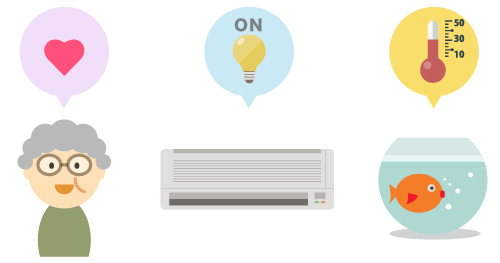
Altering the program, place and sensor introduced in the tutorial, it can be used for a solution to your daily problems.
- Setting your micro:bit in a room or toilet for the aged person living alone, can be used for remote monitoring.
- Recording the light level and temperature, you can visualize the relationship between sunshine and temperature.
- Stick a magnet on the corner of the door, then attach your micro:bit to the door frame so that the distance is formed when the door opens. Recording the change of the magnetization force with your micro:bit and TFabConnect, you can record the opening and closing history of the door.
- Attaching a waterproofed temperature sensor (TFW-TP2, etc) to your micro:bit, you can record the current value and changes in the water temperature of the biotope and pool.
- Attaching a motion sensor (TFW-RK2, etc.) to your micro:bit, you can keep such as visitors and animal behavior on record.
- Attaching an ultrasonic sensor (TFW-DS1, etc.) to your micro:bit, you can record changes in the water level of rivers and paddy fields, and if you set it on the road, you can record traffic volume.
- Attaching a sound pressuer sensor (TFW-SL1.etc) to your micro:bit, you can keep a noise record.
- Combining a motion sensor and a speaker, micro:bit can notify you with sound when someone comes.
- Combining a rainfall sensor and a speaker, micro:bit can notify you with sound when it rains.
- Combining a button and an infrared remote control, you can turn on the air conditioner from a distance.
- Combining a temperature sensor and an extractor fan, you can ventilate the vinyl house when it gets hot.
Specification
- System requirements
- 【OS】
- Windows 10
- macOS 10.15
- Chrome
- Chromium Edge
- Cloud-variable
-
【Variable names】
- half-width English numbers and symbols(@#-_)
- 16 words or less
- There is no limit to the number of variables that can be created.
- Variable names starting with __ cannot be used.
- Numeral only
- Storage period of the value is 1 day.
- It takes 1 second that micro:bit writes value to cloud-variable.
- It takes 3 seconds that micro:bit refers to cloud-variable.
- Group
-
- There is no limit to the number of group registration.
- There is no limit to the number of members in a group.
- Group name can be used with alpha-numeral and Japanese characters, using 16 characters or less.
- Social login
-
Cautions
- Due to a bug in the serial communication of micro:bit, reading and writing data may occasionally fail.
- If the school network is forbidden from using the internet to access external websites, you need to allow access to TFabConnect server and MakeCode.
- DOMAIN
- iothub.mbitc.net
- PORT NUMBER
- 443
- While micro:bit is connecting with MakeCode via WebUSB, micro:bit can not connect with TFabConnect. Close the tab for MakeCode once.